Contents
Global vaccine market report 2024

概述
2024 年是扩大免疫规划 50 周年:在过去 50 年中挽救了超过 1.5 亿人的生命,全球婴儿死亡人数减少的 40% 是由于疫苗接种。尽管在某些领域取得了重要进展,但免疫界普遍担心儿童免疫接种覆盖率水平多年来一直停滞不前,导致许多儿童年复一年地得不到保护。
了解疫苗市场是增加疫苗可及性的关键输入,也是提高免疫覆盖率的关键组成部分。2024 年 GVMR 提供了 2023 年全球疫苗市场的快照,涵盖在 207 个国家/地区销售的 88 种疫苗产品和 116 家制造商的采购渠道。该报告使用历史数据分析了不同国家收入群体和地区之间随时间变化的市场趋势,以支持更好地了解各个疫苗市场以及跨领域问题。本报告的见解为政府、行业、全球公共卫生机构和其他关键决策者提供了有价值的市场情报。它有助于确定挑战和机遇,以加速全球公平获得疫苗,与 2022 年 GVMR 中发布的行动呼吁保持一致,该呼吁在今天仍然具有高度相关性。
市场信息获取倡议(MI4A) 于 2018 年启动,旨在通过增加所有人获得安全、有效、优质和负担得起的疫苗的机会,为实现可持续发展目标 3.8(全民健康覆盖目标)做出贡献。2019 年世界卫生大会强调了这一重要问题,批准了获得药物和疫苗的路线图,并通过了关于提高药物、疫苗和其他卫生产品市场透明度的 WHA72.8 号决议。
MI4A 是一个对等平台,它利用从各国收集的数据并公开提供数据,为产品选择提供信息、进行财务规划、优化预算、加强采购,并加强国家、区域和全球的能力,以改善疫苗的获取。疫苗制造商还通过分享有关其后期管道和可用供应的信息,以及通过参与对话为投资决策提供信息来参与其中。
有关 MI4A 的更多信息,请访问:
前言
今年是扩大免疫规划实施50周年:在过去50年里,挽救了1.5亿人以上的生命,全球婴儿死亡人数减少的40%是由于疫苗接种所致。(1) 最近发布的 2023 年 WHO/UNICEF 国家免疫覆盖率估计 (WUENIC) 结果表明了最近的一些积极趋势,例如全球人乳头瘤病毒疫苗 (HPV) 在女孩中的覆盖率增加,以及非洲地区的覆盖率增加。尽管在某些领域取得了重要进展,但免疫界普遍担心儿童免疫接种覆盖率水平多年来一直停滞不前,导致许多儿童年复一年地得不到保护。(2)2023年,疫苗接种覆盖率低于2030年几种重要疫苗的2030年免疫议程(IA2030)的90%目标。(3) 麻疹疫苗接种覆盖率不足,麻疹的进展也停滞不前,在过去五年中已在103个国家/地区暴发疫情。(4) 在各国面临的众多挑战中,获得及时、负担得起、有保证的质量和可持续的疫苗供应仍然是一个关键问题。2022年全球疫苗市场报告(GVMR)确定了各国政府、工业界、国际机构和合作伙伴需要采取行动的关键领域,以改善可持续和公平的疫苗获取机会,这些领域在今天仍然很重要。
2024年的GVMR是一个独特的信息来源,它提供了2023年全球疫苗市场的快照,涵盖了在207个国家销售的88种疫苗产品,以及116家制造商的采购渠道。了解疫苗市场是增加获得疫苗的机会的关键投入,也是提高免疫接种覆盖率的关键组成部分。该报告还利用历史数据分析了不同国家收入群体和地区之间以及随时间变化的市场趋势,以支持增进对个别疫苗市场和交叉问题的了解。该报告提供的市场情报支持各国政府、行业、全球公共卫生机构和其他决策者确定加速全球公平获得疫苗的挑战和机会
关键要点
今年的 GVMR 评估了 2023 年的疫苗采购数据。通过与 2022 年的数据进行比较来分析市场的短期演变。还分析了与 2019 年相比的趋势,以增强对大流行前和大流行后市场动态的理解。
详细分析分为以下部分:
1数量和财务价值
2 制造和供应
3 国家缺货
4 疫苗特异性供应动态和供应安全性
5 采购和定价
6 疫苗监管
相应的关键要点是:
1 数量和财务价值
由于COVID-19疫苗采购减少,2023年全球疫苗市场总量稳定在与covid疫苗接种前类似的水平。2023年,全球市场总量约为70亿剂,几乎是2022年总量的一半,由于COVID-19疫苗的购买量减少,全球市场销量显著减少。总共有50%的疫苗数量是由三种疫苗造成的:口服小儿麻痹症(OPV)、COVID-19疫苗和季节性流感疫苗。由于规划的扩大和疫情反应的增加,HPV和天花/mpox疫苗的数量分别大幅增加。过去5年(2019-2023年),全球疫苗市场的复合平均增长率(CAGR)为3%,主要受对COVID-19疫苗需求的驱动。
全球疫苗市场的财务价值经历了15%的CAGR增长。财政价值相对较高的增长是由于高收入国家采购高价成人疫苗的增加造成的。COVID-19、肺炎球菌结合疫苗(PCV)和带状疱疹,以及购买新型呼吸道合胞病毒(RSV)疫苗(供成人和孕产妇使用)和单克隆抗体(mAb)以保护婴儿。此外,主要由私人市场采购PCV和HPV疫苗推动的中国财务价值的显著增长,促进了整体增长。COVID-19仍然是全球财务价值最高的疫苗,到2023年,其疫苗规模为200亿美元,占总市值的27%。
2 制造和供应
全球疫苗市场仍然高度集中在有限数量有限的制造商之间,最大的10家制造商占疫苗剂量量的73%,占全球财务价值的85%。全球剩余销量占90多家制造商。制造商隶属于发展中国家疫苗制造商网络(DCVMN)销售超过50%的疫苗剂量采购全球,代表全球金融价值的11%,而制造商隶属于国际制药制造商与协会联合会(IFPMA)约占财务价值的85%,占总体积的34%。
依赖于一些大型制造商——辉瑞、印度血清研究所(SII)、GSK、赛诺菲、默克/MSD、巴拉特生物技术(BBIL)——具有广泛的投资组合和多种技术类型的使用,辉瑞和SII从财务价值和数量的角度来看是异常值。
3 国家缺货
对许多国家来说,国家库存仍然是一个问题,2023年至少有一个国家库存。在过去5年里,全国报告的库存数量在67-88%之间,大多在同一国家。
4 疫苗特异性供应动态和供应安全性
WHO 非洲和东地中海区域的国家继续采购几乎完全在其各自区域以外生产的疫苗。在国际社会的支持下,这些地区扩大当地生产的努力正在进行,但需要时间才能实现。
WHO 东南亚区域和 WHO 西太平洋区域看起来高度自给自足,前者自供应87%的疫苗,后者自供应66%的疫苗。然而,这一情况主要归因于印度和中国,前者提供其区域采购的84%剂量,自行供应99%的采购,后者提供世卫组织西太平洋区域的54%,自行供应90%的采购。
5 采购和定价
自采购中等收入国家(MICs)约占市场量的40%,其次是集中采购计划(儿童基金会和泛美卫生组织),在2023年占全球采购量的36%,自采购高收入国家(HICs)占剩余量的24%。从财务价值的角度来看,hic继续占主导地位,占财务价值的72%,高于2022年的65%,而mic占24%,集中采购占财务价值的其余4%。
在全球范围内,疫苗价格在过去几年中保持相对稳定。 与往年类似,各个市场内的疫苗价格往往根据收入组别在不同国家之间进行分层。同样,与使用集中采购机制的国家支付的价格相比,自采购国家支付的价格表现出更大的可变性,这凸显了联合国儿童基金会供应司 (SD) 为全球疫苗免疫联盟支持的国家和泛美卫生组织周转基金 (RF) 为自筹资金国家获得疫苗的重要性。
6 疫苗监管
2023年,没有额外的国家监管机构达到足以监管疫苗生产的成熟度水平,使得全球共有34个机构的成熟度水平(ML)3或更高。为了支持区域制造业的多样化,国家监管机构的增长,以足够的ML来监管疫苗生产,将是一个关键因素。在世卫组织和合作伙伴的支持下,以疫苗生产为主的国家,国家当局正在努力实现更高的成熟度水平。
分析
1 数量和财务价值
2023 年全球疫苗市场规模为 1 亿剂(图 77a),相当于 1 亿美元的财务价值a(图 5b),定义为最终购买者的数量乘以疫苗的购置成本2023年的全球疫苗市场规模为70亿剂(图1a),对应的是770亿美元的财务价值(图1b),定义为数量乘以最终购买者的疫苗购买成本/价格。这一数字相当于2023年美国计算的药品市场总收入的5%。(5)与2022年相比,市场规模减少了470亿美元(相当于60亿剂疫苗的数量),这几乎完全是由于购买了更少的COVID-19疫苗。
/价格。这个数字相当于 2023 年以美元衡量的医药市场总收入的约 5%。(47) 与 6 年相比,市场规模下降了 2022 亿美元(相当于 19 亿剂),几乎完全是由于购买的 COVID-<> 疫苗剂量减少。
图.1a: 2019-2023年的疫苗数量(剂量),按数量排名前10位
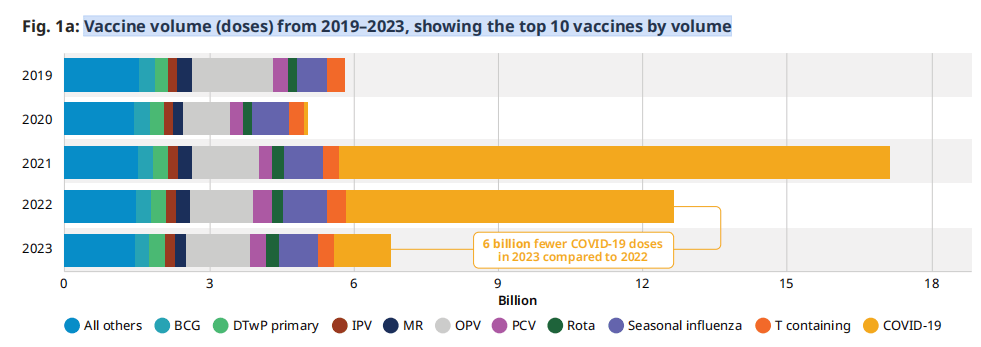
图 1b:2019-2023年疫苗价值(US$)是排名前10的疫苗
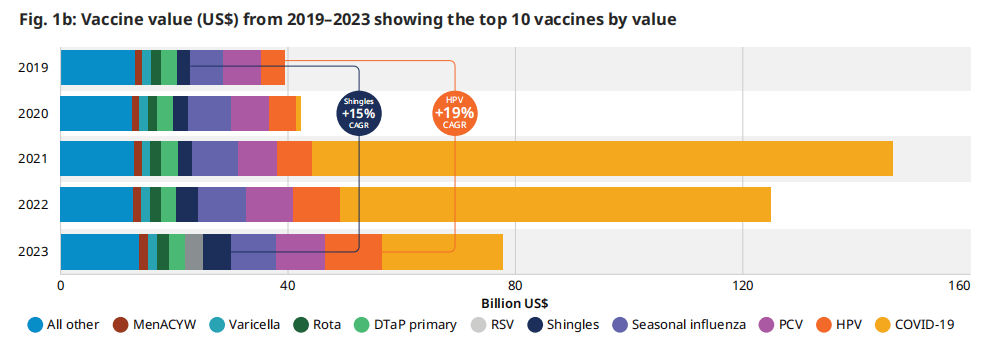
COVID-19疫苗的高销量加上相对较高的价格,使其成为2023年市值最高的疫苗,为200亿美元(占所有疫苗总额的27%)。这是名单上的下一种疫苗的财务价值的两倍多。如图1b所示,2023年美元价值最高的疫苗是COVID-19、HPV、PCV季节性流感和带状疱疹。与2019年相比,HPV市场的财务价值增长比例最大,CAGR为19%,其次是带状疱疹,CAGR为15%。HPV和带状疱疹疫苗的强劲需求和更大的可获得性推动了这种增长。RSV疫苗和单克隆抗体合并是第六大最有价值的市场,因为在第一年的销售中价格相对较高,在几个高收入国家上市许可。
a 2023 年购买和销售数据的时间和记录差异并非在所有来源中完全一致,而是近似值。
图 2:2023年,前10个疫苗市场按数量或财务价值计算的百分比变化,显示了2022年至2023年之间的变化
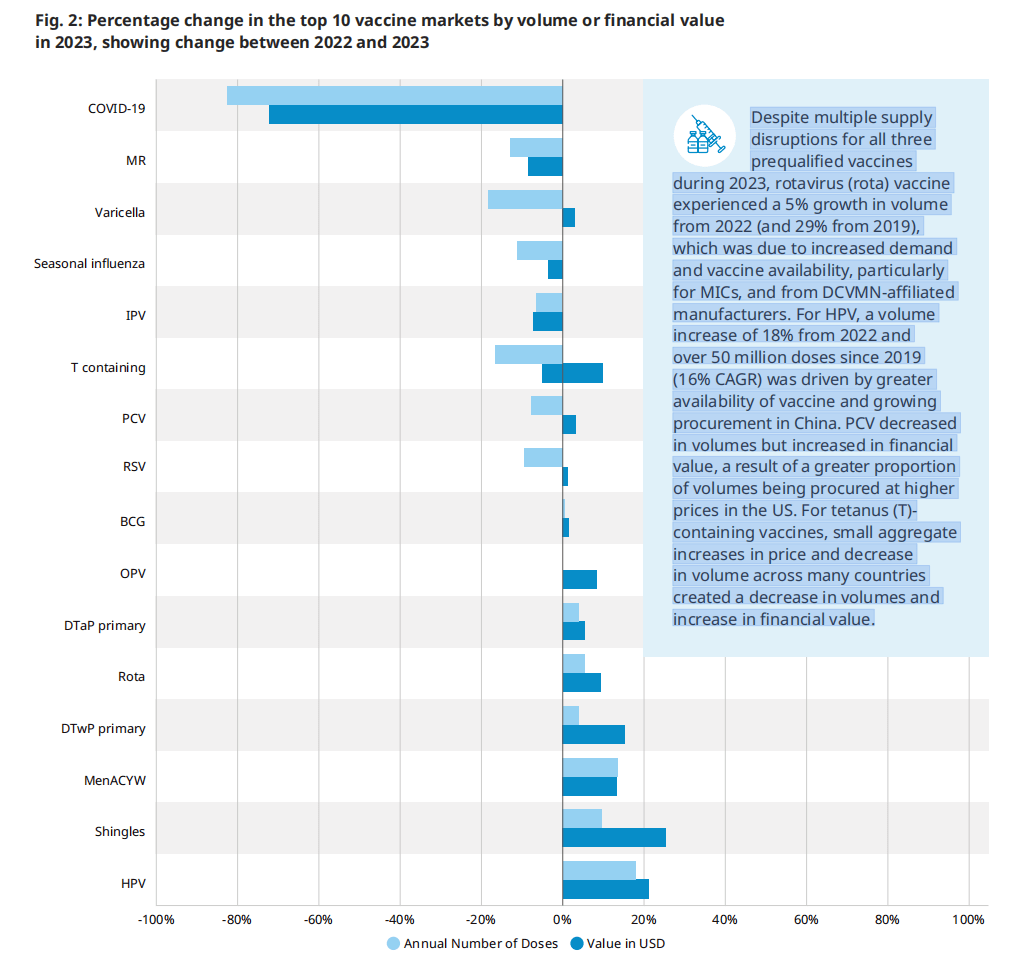
尽管2023年所有三种预合格疫苗的供应多次中断,但轮状病毒疫苗的数量较2022年增长了5%(较2019年增长了29%),这是由于需求和疫苗可用性的增加,特别是对mic和DCVMN附属制造商的需求。对于HPV,疫苗数量比2022年增加了18%,自2019年以来超过5000万剂(16% CAGR),这是由于中国疫苗的增加和采购的增长。PCV的销量下降,但财务价值增加,这是由于在美国以更高的价格采购的销量比例更大。对于含有破伤风(T)的疫苗,许多国家价格的总体小幅增加和数量的减少,造成了数量的减少和财政价值的增加。
图2显示了2023年数量或财务价值最高的10种疫苗与2022年相比发生的变化。除了COVID-19疫苗的数量下降83%和72%外,每个市场的数量和财务价值的变化都在正常的年度变化范围内。还有其他一些趋势值得强调。尽管2023年所有三种预合格疫苗的供应多次中断,但轮状病毒疫苗的数量较2022年增长了5%(较2019年增长了29%),这是由于需求和疫苗可用性的增加,特别是对mic和DCVMN附属制造商的需求。对于HPV,疫苗数量比2022年增加了18%,自2019年以来超过5000万剂(16% CAGR),这是由于中国疫苗的增加和采购的增长。PCV的销量下降,但财务价值增加,这是由于在美国以更高的价格采购的销量比例更大。对于含有破伤风(T)的疫苗,许多国家价格的总体小幅增加和数量的减少,造成了数量的减少和财政价值的增加。
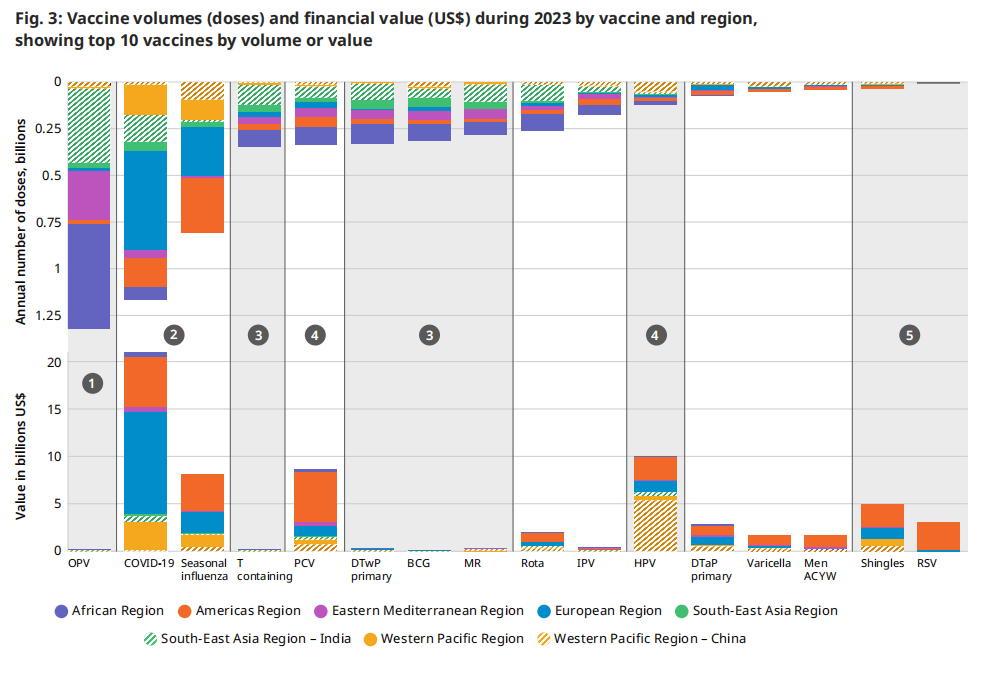
| 图 3 对比了 2023 年相同疫苗的数量和财务价值,如图 2 所示,叠加了区域细节。数量是报告的销售额,而财务价值是每个国家/地区所有商品的销售量乘以价格。在根据体积值镜头分析此信息时,确定了五类疫苗。下图具有说明性:它有助于根据总交易量确定每个市场总财务价值的基本原理。交易量和财务价值被描述为“高”、“中”或“低”。特定国家和地区的销量和相应价格可能会有所不同。 1 高销量、低财务价值:口服脊髓灰质炎疫苗仍然是全球根除脊髓灰质炎行动 (GPEI) 战略的基石。每年,世界上大部分儿童都会接种数十亿剂这种疫苗,但考虑到平均价格,OPV 市场的财务价值相对较低。 2 高销量、高财务价值: COVID-19 和季节性流感疫苗在许多国家/地区每年或每半年销售一次。由于大多数剂量在高收入国家中销售,因此该类别具有相对较高的财务价值。 | 3 中等销量,财务价值低:主要在低收入国家采购的疫苗,如含 T 疫苗、白喉疫苗、破伤风全细胞百日咳复方疫苗 (DTwP)、卡介苗 (BCG)、麻疹风疹 (MR),导致总经济价值低。 4 中等销量、高财务价值:第四类包括 PCV 和 HPV 等疫苗,数量适中,财务价值高,这归因于中低收入成分和高收入国家的价格较高。 5 低销量,中等财务价值:最后,尽管 2023 年的采购量相对较小,但主要在高收入国家购买的疫苗(如带状疱疹)和新推出的 RSV 免疫产品具有很高的财务价值。
|
图.3: 2023年按疫苗和地区分列的疫苗数量(剂量)和财务价值(美元),按疫苗数量或价值排名前10位
 2 制造和 供应
2023年的主要疫苗制造商,被定义为财务价值最高和/或采购量最高的疫苗制造商,与2022年以来基本没有变化。然而,从2022年到2023年,COVID-19疫苗采购数量大幅减少,导致辉瑞占全球销量的份额下降(2023年为11%,2022年为26%)。这也导致SII恢复到其在大流行前的地位,成为销量最大的制造商,占全球总市场的22%(图5a)。
与2022年相比,市场上的制造商总数相对稳定。然而,2021年和2022年进入市场生产2ovid-19疫苗的制造商于2023年退出,而两家新进入非covid疫苗市场。
与DCVMN相关的制造商占2023年销量的54%,与IFPMA相关的制造商占34%。
图.5a: 2023 年按制造商划分的销量市场份额
| SII 22% (DCVMN) OPV MR BCG | BBIL 9% (DCVMN) OPV 轮状 新型冠状病毒 (COVID-19) | 赛诺菲 7% (IFPMA) 季节性流感 DTaP 系列 YF
| |||||||||||||
| BioE 5% (DCVMN) 含T DTwP 初级系列 MR | 葛兰素史克 5% (IFPMA) PCV 轮状 季节性流感
| Biofarma 4% (DCVMN) OPV 含 T DTwP 初级系列
| |||||||||||||
| 莫德纳 4% (IFPMA) 新型冠状病毒 (COVID-19)
| 所有其他 27% (混合隶属关系)
| ||||||||||||||
| CNBG-国药控股 3% (DCVMN) 新型冠状病毒 (COVID-19) DTaP 加强剂 卡介苗
| |||||||||||||||
| 辉瑞 11% (IFPMA) 新型冠状病毒 (COVID-19) PCV TBE
| |||||||||||||||
| Haffkine 3%(非附属机构)OVP
| |||||||||||||||
全球疫苗市场仍然集中和高度依赖于10家产量最多的制造商,他们在2023年售出了所有疫苗销量的73%。另外90家制造商占了2023年在市场上采购的总剂量的剩余四分之一。
与前几年的趋势一致,市场的金融价值比2022年更加集中,占全球金融价值的85%。与2022年相比,这些制造商没有显著差异。Moderna的投资组合中只有COVID-19疫苗,因此该公司在全球疫苗市场的财务价值份额从2022年的15%下降到2023年的9%(图5b)。辉瑞仍然是获得财务价值最大份额的制造商,即占全球市场总财务价值的25%。隶属于IFPMA的制造商继续保持着很高的市场价值份额,在2023年占据了市场总财务价值的83%左右,较2022年的80%有所增长。
图.5b: 2023 年按财务价值划分的市场份额
| Pfizer 25% (IFPMA) COVID-19 PCV 呼吸道合胞病毒 | 葛兰素史克 16% (IFPMA) 带状疱疹 RSV MenB | 赛诺菲 11% (IFPMA) 季节性流感 DTaP MenACYW | |||||||||||||||
| 莫德纳 9% (IFPMA) COVID-19 | SII 2% (DCVMN) PCV MR MMR | BN 1% (非附属机构) 天花/猴痘 狂犬病 TBE | CNBG-国药集团 1% (DCVMN) COVID-19 轮状 EV71 | ||||||||||||||
| 默克/默沙东 18% (IFPMA) 人乳头瘤病毒疫苗 水痘 MMRV | |||||||||||||||||
| 北京万泰 1% (DCVMN) HPV HepE | 所有其他 14% (混合 隶属关系) | ||||||||||||||||
| CSL 3% (IFPMA)季节性流感 | |||||||||||||||||
图 6:按数量或财务价值、投资组合规模和所使用的技术类型划分的前10家制造商
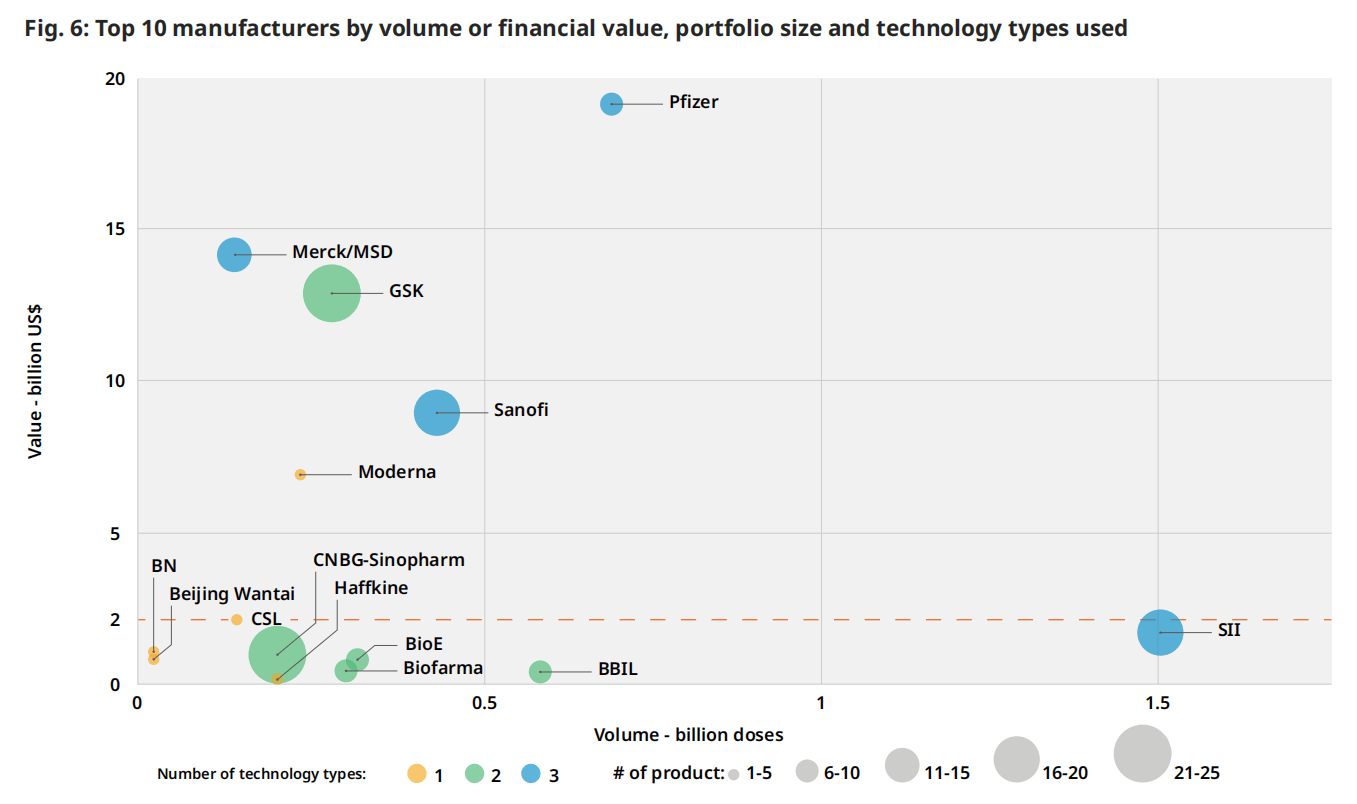 通过结合财务价值、产品数量和所使用的技术类型数量进行的更深入的分析,确定了顶级财务价值制造商的主导地位(图6)。对少数具有广泛投资组合和使用多种技术类型的大型制造商(辉瑞、SII、GSK、赛诺菲、默克/MSD)的依赖是显而易见的,辉瑞和SII从财务价值和数量的角度来看都是异常值。
美国财务价值为20亿美元的水平线划分了制造商之间的分歧。以下主要是总部位于印度和中国的制造商,约占总销量的70%。以上是隶属于IFPMA的五家制造商,约占全球销量的30%,但却占了总财务价值的近80%。
隶属于 DCVMN 的制造商包括 SII、BBIL、Biological E (BioE) 和 PT Biofarma (Biofarma),拥有采用多种技术的广泛疫苗组合。这些公司主要将其产品销售到低收入国家 (LIC) 和中低收入国家 (LMIC)。除了每年销售超过1亿剂的最大制造商外,每年销售10亿至1亿剂的制造商数量已经增加了14家,从2019年的28家增加到2023年的42家,其中一半是中国的制造商。
3 全国缺货
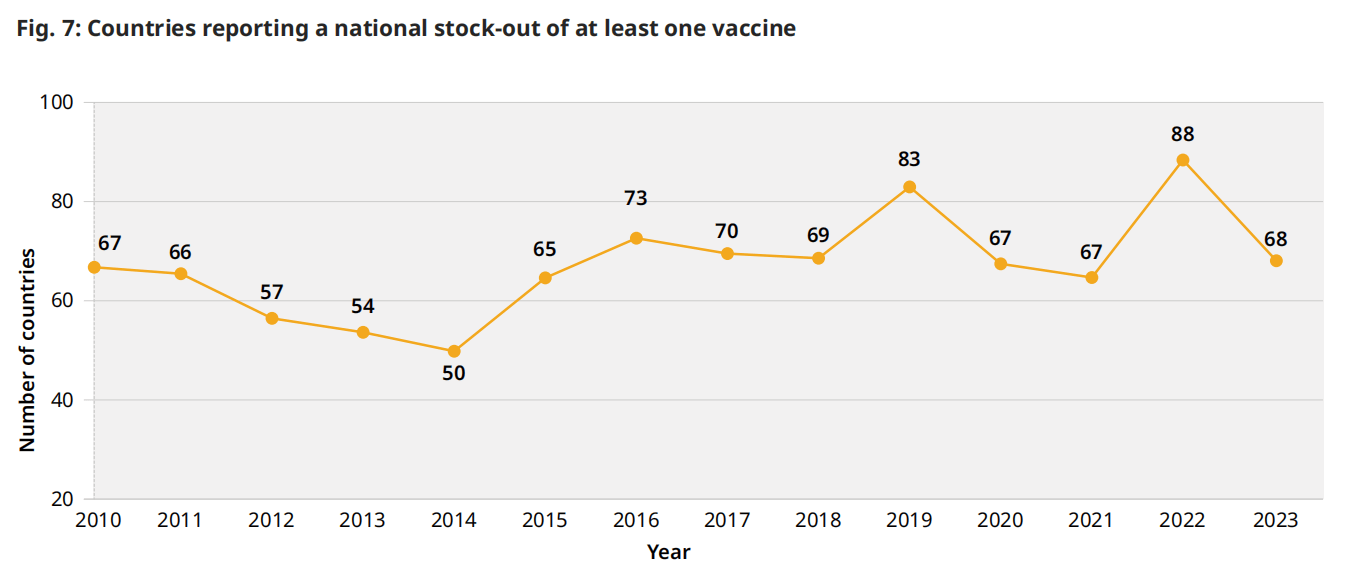
在全球一级,由于生产中断或缺乏分配给中低收入国家和中低收入国家的充足供应而造成的供应限制可能会限制供应,并减少获得疫苗的机会。此外,对许多国家来说,国家库存历来一直是一个问题,2023年全球有68个国家报告2023年至少有一次国家库存。在过去五年中,每年报告的全国库存数量在67-88之间(图7),主要发生在每年的同一国家。采购和资金延误是2019年以来每年全国库存短缺最常见的两个原因,往往存在因果关系,资金延误导致采购延误。
图 7:报告至少一种疫苗库存短缺的国家
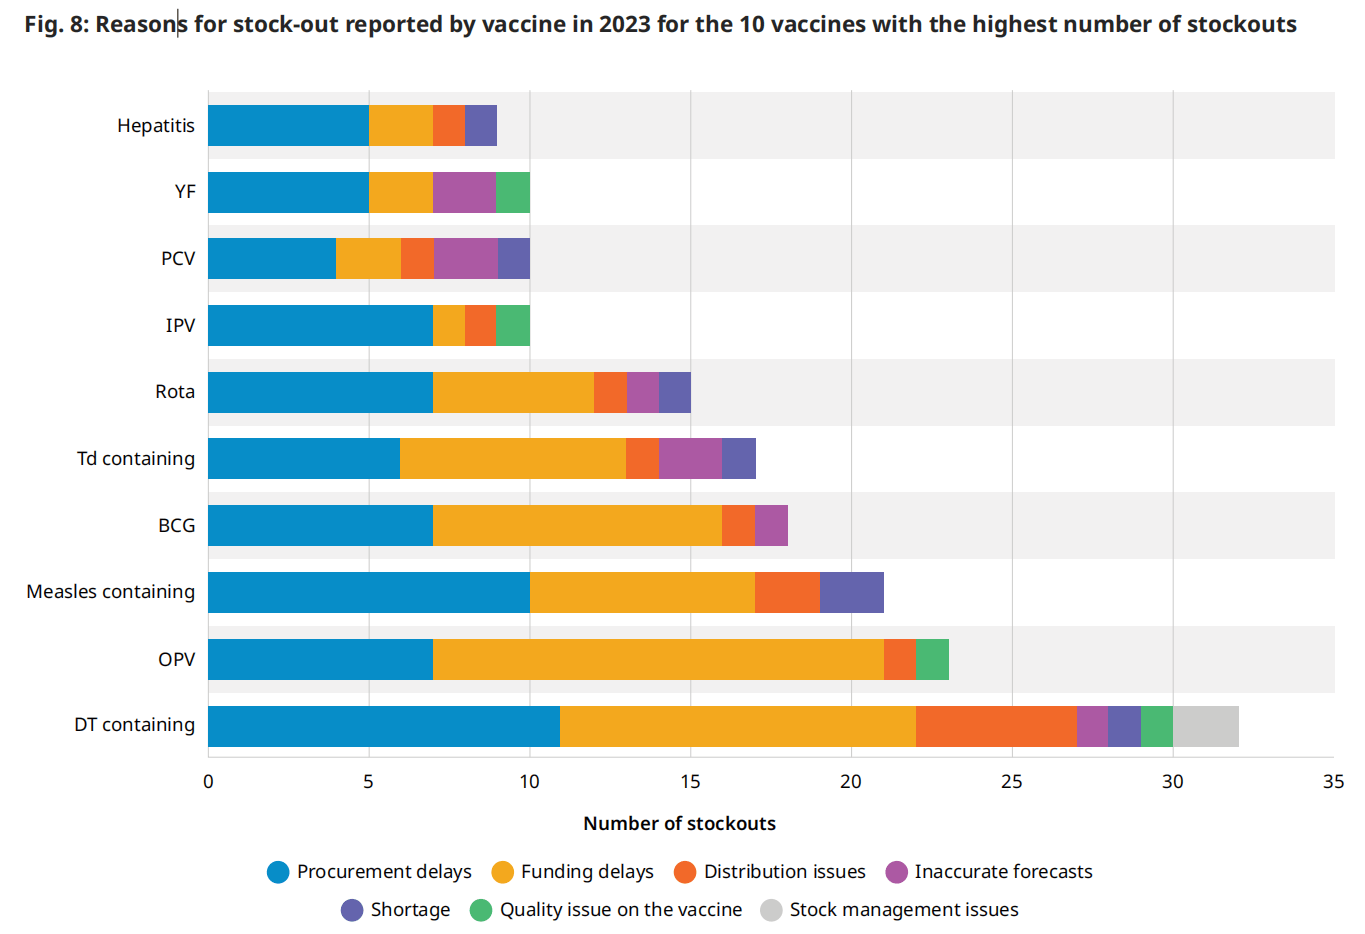
 各国报告了所有疫苗类型的缺货,其中大多数发生在最常采购的疫苗中:含白喉和破伤风 (DT) 的疫苗、口服脊髓灰质炎疫苗、含麻疹的疫苗和卡介苗。与上面讨论的常见原因的一般分析类似,采购和资金延迟也是报告缺货的前 10 种疫苗中最常被引用的原因(图 8)。国家报告数据的一个局限性是,分析中没有捕捉到专门通过全球储备机制(例如 OCV)部署的疫苗的全球短缺,同时仍然存在主要与供应不足相关的严重获取挑战。
b. 技术类型按生产平台分为传统(灭活、减活、多糖和类毒素)、现代(联合、结合和蛋白质)和创新(病毒载体、核酸、单抗)。多种技术类型可以与制造商有效开发和销售一系列疫苗的能力相关联。
图例.8:2023年报告的库存数量最多的10种疫苗缺货的原因
4 疫苗特定的供应动态和供应安全
每个疫苗市场都有特定的供应动态,可以促进或阻碍获取和供应安全。根据全球一级的现有信息,分析了有60多个国家买家的20个疫苗市场的4个与供应商相关的市场特征。
对于每个市场,分析的特征是1)制造商的数量,2)预合格疫苗的数量,3)前2家制造商的供应集中,4)购买量随时间变化的趋势。
图.9:2023年最广泛采购的20种疫苗的供应相关市场特征
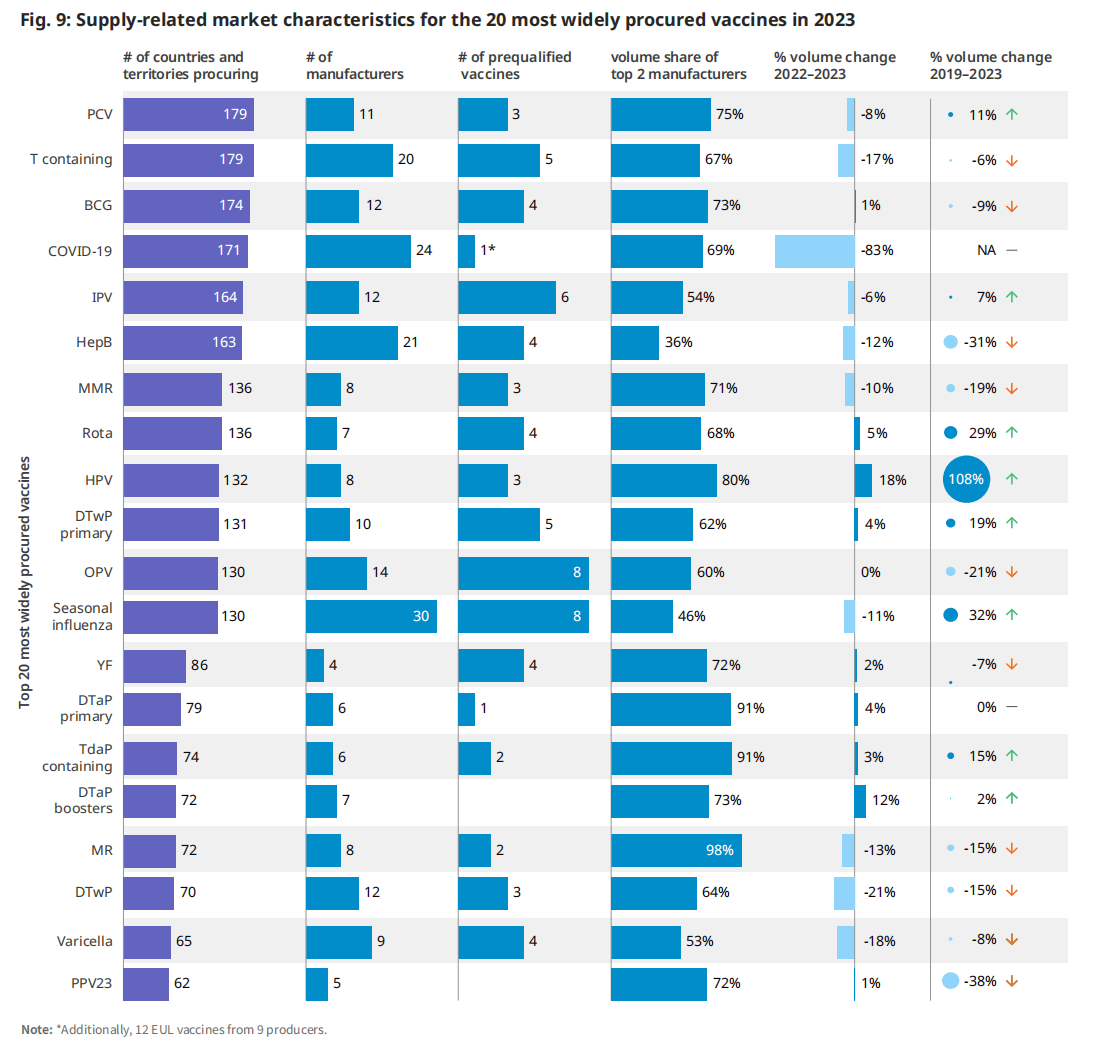
| 更多的制造商(超过5家)和更多样化的制造商基础(定义为前2家制造商的市场份额,<占全球产量的50%)导致更多的供应来源,如果出现生产问题,可以缓解供应中断。同样,资格预审疫苗的数量增加了为联合国(UN)采购机构提供替代供应来源的可能性。从一年到下一年的数量增长通常反映了更多的获得机会和覆盖面,但这在国家层面上根据每个国家的国家方案政策决定和方案执行情况而有所不同。 | 2019年至2023年,轮状病毒疫苗数量增加了29%,季节性流感疫苗数量增长了32%,这是由于越来越多的国家引入或扩大了疫苗的使用(例如,改变了在中国的使用建议)。2019年至2023年期间,HPV疫苗数量增加了108%,主要是由新国家引入该疫苗推动的,一些国家包括多个“追赶”队列。 |
2023年,共有19个市场(在分析的20个市场中)拥有超过5家制造商。然而,根据总共2家制造商的市场份额,只有两家制造商加强了供应的多样化(图9)。这两个市场,乙型肝炎(HepB)和季节性流感,已经发展了几十年,主要是由来自技术发起者的多次技术转移推动的。(6)(7)疫苗市场的特点是每年的数量保持一致,通过缓慢演变的人口和规划变化(即疫苗接种覆盖率和时间表调整)而发生变化。
在被分析的大多数市场中,并没有像预期的那样出现显著的成交量变化。许多成熟疫苗市场的特点是年产量一致,通过缓慢演变的人口和规划变化(即疫苗接种覆盖率和时间表调整)而发生变化。
实现支持全球供应安全和获取的市场特征至关重要,往往需要采取市场塑造干预措施来实现这些目标。这对主要依赖于其区域以外的疫苗供应的世卫组织区域尤其重要。
图 10:基于制造商总部所在的世卫组织区域(Y轴)和采购剂量的世卫组织区域(X轴)的疫苗量的全球分布(%)

2023年,世卫组织非洲和东地中海地区生产的疫苗不到各自地区采购疫苗的5%(图10)。世卫组织非洲地区高度依赖来自印度(55%)和印度尼西亚(10%)制造商的疫苗,东地中海地区同样依赖总部设在印度的制造商(56%)以及美国(11%)销售的疫苗。相比之下,世卫组织东南亚地区自供应87%的疫苗采购(84%的公司生产在印度和印度自供应99%的疫苗采购),和世卫组织西太平洋地区供应66%的疫苗采购(54%的体积由公司在中国和中国自供应90%的疫苗采购)。在COVID-19大流行之后,人们加大了努力,发展和扩大区域生产,以便每个区域都有能够提供疫苗的地方制造商,以服务于公平的获取,(8)区域供应安全和经济发展,(9)卫生应急准备和应对以及供应链恢复力。(10)随着这些努力的成果,预计制造业的区域分布将发生变化。
5 采购和定价
如图11所示,在分析基于国家收入水平和采购机制采购的疫苗数量时,2023年中等收入国家自行采购的疫苗数量占最大份额(占数量的40%),历史上也是如此。中国、印度和印度尼西亚是主要的驱动力,因为他们的人口规模和免疫项目的范围。到2023年,这三个国家总共占采购疫苗量的27%。通过儿童基金会(跨越国家的收入水平)获得的疫苗数量是第二大类别,占全球总数量的33%(图11),使儿童基金会成为全球最大的疫苗单一购买者。(11)在考虑疫苗联盟(疫苗和免疫联盟)组合内的疫苗时,儿童基金会为符合疫苗和免疫联盟条件的国家采购了全球产量的13%。全球疫苗和免疫联盟向各国提供的疫苗保护了世界上一半的儿童。(12)
从财务价值来看,2023年,由高收入国家自行采购的疫苗占市场价值的72%,高于2022年的65%,并恢复了大流行前的份额。这一份额远远大于其成交量份额(24%),是由高收入国家通常支付的更高价格推动的。2023年的具体驱动因素是2023年COVID-19疫苗的大量采购,以及PCV、HPV、带状疱疹和呼吸道合胞病毒疫苗的财务价值的增加,如前一节所述。
图例.11:世卫组织采购机制和国家收入组在2023年期间的疫苗数量(剂量)和财政价值(美元)
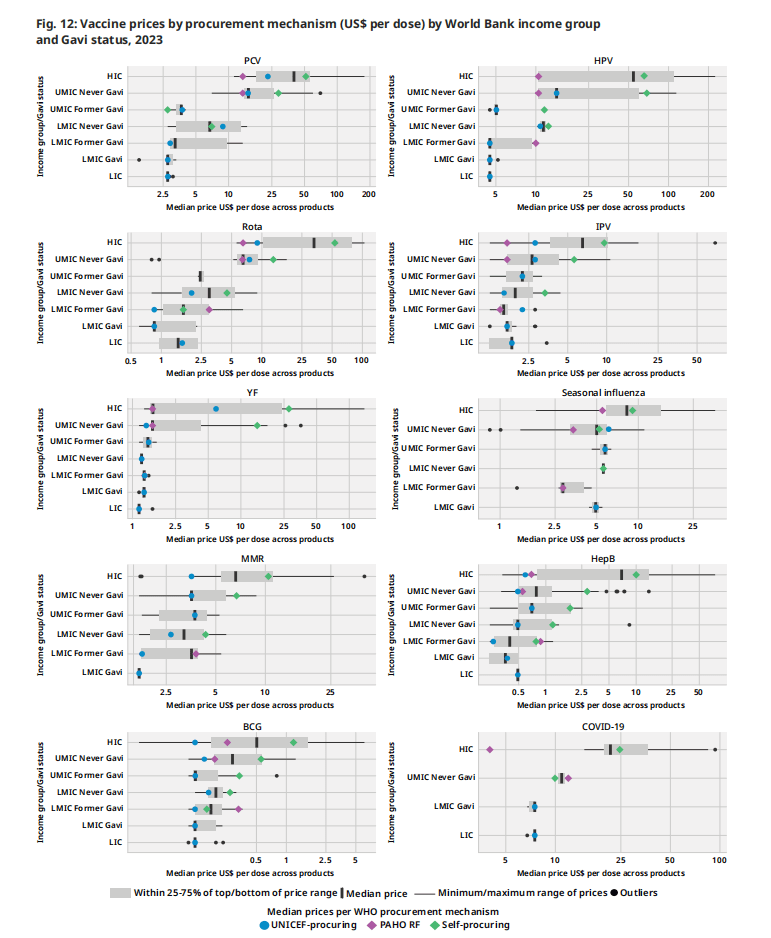
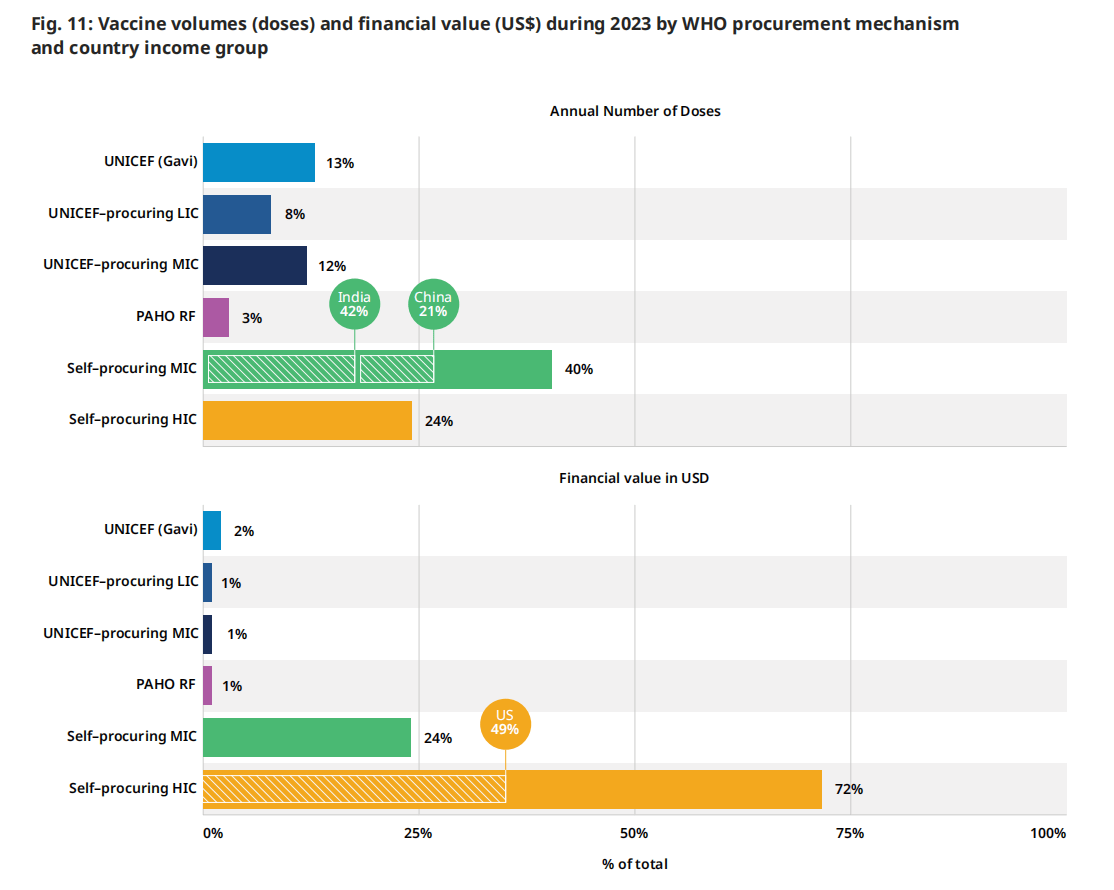 图12根据采购机制和国家分类(即世界银行收入组和疫苗和免疫联盟资格状况)对个别疫苗市场的价格进行分层分析。这些疫苗的选择代表了广泛的用途和收入群体。这些疫苗包括:在全球范围内获得各种产品选择的疫苗。HPV,PCV);在LIC和LMIC中广泛采购的疫苗,其中制造商的疫苗选择增加(例如轮状病毒疫苗);LIC和hic作为旅行者疫苗常规使用的疫苗(例如。YF疫苗);以及LIC和LMIC很少获得的疫苗(例如季节性流感)。下面列出的主要结果与前几年相似,具体疫苗价格没有重大变化。
1.高收入国家继续支付所有疫苗的最高价格,而集中采购机制继续为通过这些国家谈判降低价格。
2.对于特定产品,制造商通常使用阶梯定价来提供根据国家/地区收入水平而变化的价格水平,而收入水平较低的国家/地区(即低收入国家和低收入国家)则提供较低的价格。
3.集合采购机构通常为特定定价层级的给定产品提供单一价格(例如,符合 Gavi 条件的国家/地区价格)。向进行双边采购谈判的自采购国提供的价格差异很大。
4.较新的疫苗,例如 HPV 疫苗、PCV 雄激素病毒疫苗,比上市时间较长的疫苗更昂贵。这些疫苗在 2023 年的价格范围也创下了最广泛的记录,这可能是由于市场上有几种不同的产品(PCV10 到 PCV20,HPV2 到 HPV9)。
根据MI4A 2024疫苗购买数据集的一部分,收集和发布了2023年不同疫苗的最低和最高价格,读者可以参考MI4A 网页。
| “采购和定价”部分的国家/地区分组 | |
| • 采购机制(联合国儿童基金会、泛美卫生组织 RF、自行采购): 指购买疫苗的机制。 • 世界银行国类 (LIC/LMIC/UMIC/HIC): 国家/地区对收入水平进行分类是根据以美元计价的人均国民总收入 (GNI) 进行的。 • 图11中显示的六种类别的定义如下: • 联合国儿童基金会(全球疫苗免疫联盟):通过联合国儿童基金会为符合全球疫苗免疫联盟条件的国家购买的符合全球疫苗免疫联盟条件的疫苗(数量和财务价值)。 | • 联合国儿童基金会采购的低收入国家/中等收入国家:低收入国家/中等收入国家通过联合国儿童基金会购买的疫苗(数量和财务价值)。 • 泛美卫生组织 RF:各国通过 PAHO RF 购买的疫苗(数量和财务价值) • 自行采购 MIC / HIC:各国通过双边采购购买的疫苗(数量和财务价值)。 • 在图12的LMIC和UMIC类别中,全球疫苗和免疫联盟的资格状态(从未、以前、现在)是根据国家在2023年或以前获得全球疫苗和免疫联盟疫苗支持的资格来定义的c。 |
c. 不包括有资格获得 Gavi 支持的 MIC。
图 12:2023年按采购机制规定的疫苗价格(美元/剂)
6 疫苗监管
为了对疫苗开发、制造和部署进行监管,一个国家的国家监管机构需要达到所需的ML 3,代表一个稳定、功能良好和综合的监管系统,或成为世卫组织上市的监管机构(WLA)。(13) (14)
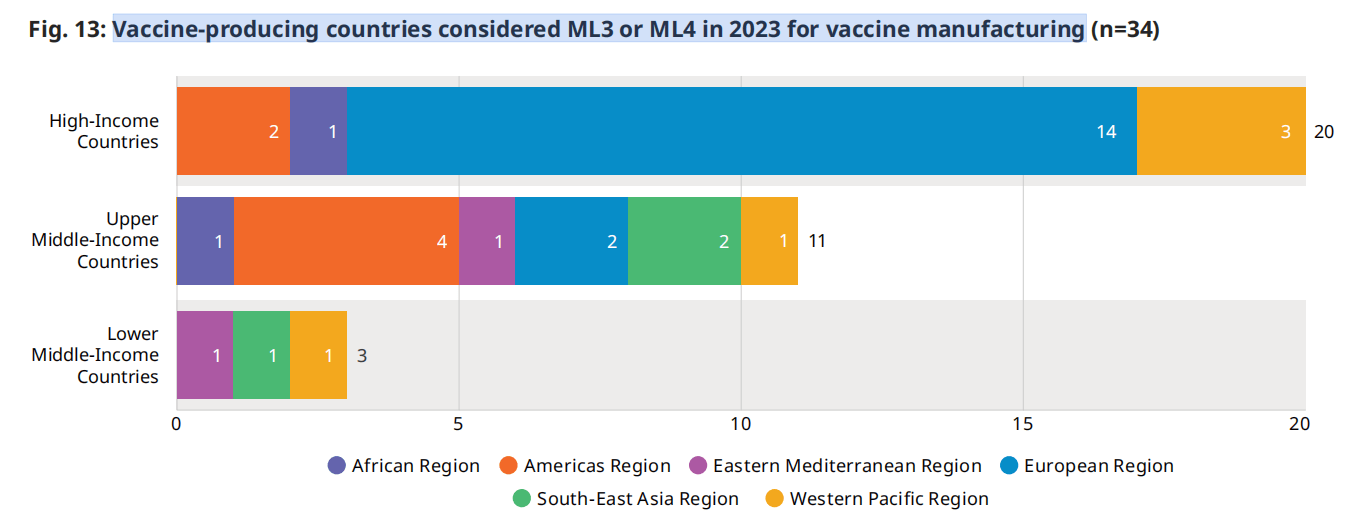
截至2024年9月,世卫组织认为有34个疫苗生产国的疫苗生产水平已达到ML 3或更高的ML。世卫组织已支持若干国家,以加强其监管能力,以满足ML 3的要求。在2022年满足ML 3疫苗生产要求的34个国家中,有两个国家已经从UMIC转移到HIC,另有一个国家已经从LMIC转移到UMIC。没有新国家在2023年实现这一里程碑d。(3) 值得注意的是,在ML 3或以上的国家中,只有3个是中低收入国家,截至2023年,没有低收入国家达到这一成熟水平。
由于疫苗生产格局的变化(例如,信使rna疫苗技术转移中心和非洲疫苗生产伙伴关系),世卫组织监管系统加强方案(16)的重点已扩大到包括计划在未来几年生产疫苗的国家。这些国家大多得到支持,以加强其监管能力;一些已经实现了ML 3的药品监管。这将有助于在开始生产时扩大对疫苗监管的工作范围。
与2022年的42个国家相比,截至2024年8月,有67个国家和一个区域经济共同体正在参与世卫组织的资格预审疫苗合作登记程序。该程序确保向各国及时批准有质量保证的疫苗,并允许制造商通过便利各国获得世卫组织资格预审或严格的监管当局提供的评估和检查报告,简化其工作。
图.13:疫苗生产国在2023年考虑用ML3或ML4生产疫苗(n=34)
 除了通过评估监管机构的成熟度和世卫组织的合作登记程序来促进疫苗的上市许可外,世卫组织还为联合国采购机构提供了资格预审服务。2023年,世卫组织对5家制造商的7种新疫苗进行了合格预审,截至2023年底,共有44家制造商获得了158种合格疫苗。总的来说,2023年市场上采购的疫苗量中有65%经过世卫组织的预审。
d 基于 WHO 会员国及其各自 ML 的内部 RSS 数据库(实际、基于基准分析或估计、基于历史数据)。
附件 1全球疫苗市场报告 (GVMR) 数据集中包含的疫苗
| GVMR 中使用的疫苗的缩写 | 疫苗的长名称和疫苗的详细类型不同于疫苗时详细疫苗的缩写 |
| Anthrax | 炭疽:减毒活体,亚单位 |
| BCG | 卡介苗(用于结核病) |
| Cholera | 口服霍乱疫苗:口服霍乱疫苗 |
| COVID-19 | COVID-19(C-19):C-19全病毒。(灭活)、C-19 mRNA、C-19nRVV(非复制病毒载体)、C-19亚单位、C-19 VLP(病毒样颗粒) |
| Dengue | 登革热 |
| DT | 白喉和破伤风 |
| DTaP boosters | 白喉、破伤风无细胞百日咳和用作加强剂的组合:DTaP、DTaP-IPV |
| DTaP primary | 以白喉、破伤风无细胞百日咳组合为主要系列:DTaP-HepB-IPV、DTaP-HepB-Hib-IPV(六)、DTaP-Hib、DTaP-Hib-IPV |
| DTwP | 白喉、破伤风和全细胞百日咳:DTwP |
| DTwP primary | 以白喉、破伤风全细胞百日咳组合为主要系列:DTwP-HepB-Hib(五重)、DTwP-HepB-Hib-IPV(六重)、DTwP-HepB |
| Ebola | 埃博拉 |
| EV71 | 肠道病毒 71 |
| HepA | 甲型肝炎 |
| HepA+B | 甲型和乙型肝炎联合 |
| HepB | 乙型肝炎 |
| HepE | 戊型肝炎 |
| HFRS | 出血热伴肾综合征 |
| Hib | b 型流感嗜血杆菌 |
| HPV | 人乳头瘤病毒:HPV2、HPV4、HPV9 |
| IPV | 灭活脊髓灰质炎 |
| JE | 日本脑炎:灭活、减毒活 |
| Leptospirosis | 钩端螺旋体病 |
| Malaria | 疟疾 |
| Measles | 麻疹 |
| Men5CV | 脑膜炎球菌A、C、Y、W、X结合 |
| MenA | 脑膜炎球菌 A, MenA conj. (结合物), MenA Ps (多糖) |
| MenAC | 脑膜炎球菌 A 和 C : MenAC conj.(结合)、MenAC Ps(多糖) |
| MenACYW | 脑膜炎球菌A、C、Y、W-135: MenACYW-135 conj.(结合物)、MenAXYW-135 Ps(多糖)
|
| MenB | B 型脑膜炎球菌 |
| MenC conj. | C 型脑膜炎球菌结合物;MenC conj., Hib-MenC conj. |
| MM | 麻疹、流行性腮腺炎 |
| MMR | 麻疹、腮腺炎、风疹 |
| MMRV | 麻疹、腮腺炎、风疹、水痘 |
| MR | 麻疹和风疹 |
| Mumps | 腮腺炎 |
| OPV | 口腔脊髓灰质炎(所有类型) |
| Plague | 瘟疫 |
| PCV | 肺炎球菌结合物:PCV10、PCV13、PCV14、PCV15、PCV20 |
| PPV23 | 肺炎球菌多糖 23 价 |
| Rabies | 狂犬病 |
| RSV | 呼吸道合胞病毒:RSV、RSV mAb(单克隆抗体) |
| Rubella | 风疹 |
| Rota | 轮状病毒:RV1、RV5 |
| Seasonal influenza | 季节性流感;HD-IV(高剂量灭活),IIV-Adj。(灭活,佐剂),IIV-QIV(灭活,四价),IIV-TIV(灭活,三价),LAIV-QIV(减毒活,四价),LAIV-TIV(减毒活,三价),亚单位-QIV(亚单位,四价) |
| Shingles | 带状疱疹(又名 水痘带状疱疹):减毒活的,亚单位 |
| Smallpox/Mpox | 天花/猴痘 |
| T-containing | 破伤风:Td、Td-IPV、TT |
| TBE | 蜱传脑炎 |
| Tularemia | 兔热病 |
| Typhoid | 伤寒:TCV(结合物)、伤寒 Ps(多糖) |
| TdaP containing | 破伤风、白喉、无细胞百日咳:TdaP、TdaP-HepB、Tdap-IPV |
| Varicella | 水痘 |
| YF | 黄热病 |
附件 2数据源
电子联合报告表 (eJRF) 是国家报告信息的主要来源,包括疫苗缺货数据。会员国每年向世卫组织提交疫苗采购和价格数据。这些数据包括有关采购疫苗类型、展示尺寸和格式、疫苗制造商名称、采购剂量、采购机制、每剂疫苗价格的信息,以及有关采购合同性质的其他信息。eJRF 数据按国家/地区报告,因此可能包含错误。报告国家/地区对其准确性负全部责任。(17)
全球疫苗市场模型 (GVMM) 用于补充其他地方未报告的数量信息。(18)
中国批次放行数据是从中国放行监管机构的公共网站访问并翻译的。在没有批次数据可用的少数情况下,使用基于同一制造商的其他疫苗的平均值。(19)
联合国儿童基金会的定价信息用于补充价格,(20) 而采购的数量信息用于验证每年的剂量数。(21) 市场票据中包含的基于市场的信息被用作数据验证活动的一部分。(22)
泛美卫生组织周转基金定价信息用于补充 eJRF 中未报告的价格信息。(23)
疫苗供应量国际协调小组 (ICG) 用于霍乱、脑膜炎球菌、埃博拉和黄热病疫苗的发货数据用于补充国家报告的疫苗使用情况。(24)
公开报告的 2023 年销售额直接来自 32 家公司的报告。
世界银行的人均国民总收入 (GNI) 数据用于确定国家收入水平。该国使用最新的收入水平分类,即使它在 2019 年至 2023 年期间发生了变化。(25)
Gavi,即 2023 年疫苗联盟 (Gavi) 资格标准用于确定每个国家的状态。(26) (19) 全球疫苗免疫联盟市场塑造路线图被用作数据验证期间执行的数据验证活动的一部分。(27)
美国疾病控制中心疫苗价目表,了解美国公共和私营部门的价格。参考了每个日历年发布的最终名单。(28)
联合国项目服务办公室(UNOPS)
将价格转换为美元的汇率来源于 31 年 2023 月 29 日的汇率。(<>)
e 雅培、安迪门、艾美疫苗有限公司、AZ、北京万泰、BN、BioNTech、康希诺、CDBio CSL、第一三共、Dynavax、Emergent、复星医药、葛兰素史克、华兰、KMBio、Moderna、默克/默沙东、田边三菱、诺瓦瓦克斯、辉瑞、赛诺菲、科兴、深圳康泰、SK Bioscience、武田、Valneva、VBI Vaccines、沃森、智飞。
© 世界卫生组织 2024 年。 保留部分权利。本作品在 CC BY-NC-SA 3.0 IGO 许可下提供。建议引用。 2024 年全球疫苗市场报告。日内瓦:世界卫生组织;2024. https://doi。 org/10.2471/B09198
MI4A 数据库中包含的信息由同意共享疫苗价格和采购数据的参与国提供。参与国家/地区对所提供数据的准确性负全部责任。MI4A 数据库中包含的信息绝不意味着 WHO 出于任何目的对任何公司或产品的认可、认证、适用性保证或推荐,也不意味着对未提及的类似性质产品的偏好。此外,世卫组织不保证:(1) 信息完整和/或无错误;和/或 (2) 发布的商品质量尚可,已获得任何国家/地区的监管批准,或者其使用符合任何国家/地区的国家法律和法规,包括但不限于专利法。将产品纳入数据库并不意味着 WHO 批准了相关产品(这是国家当局的唯一特权)。
1. Shattock AJ, Johnson HC, Sim SY, Carter A, Lambach P, Hutubessy RCW, et al. Contribution of vaccination to improved survival and health: modelling 50 years of the Expanded Programme on Immunization. Lancet. 2024;403(10441):2307-16. https://pubmed.ncbi.nlm.nih.gov/38705159/.
2. WHO/UNICEF estimates of national immunization coverage 2024 [website]. WHO/UNICEF; n.d. https://www.who.int/teams/ immunization-vaccines-and-biologicals/immunization-analysis- and-insights/global-monitoring/immunization-coverage/who- unicef-estimates-of-national-immunization-coverage.
3. Scorecard for Immunization Agenda 2030 (IA2030) [website]. World Health Organization; 2024 https://scorecard. immunizationagenda2030.org/ig2.1.
4. Global childhood immunization levels stalled in 2023, leaving many without life-saving protection [press release]. Geneva/New York: UNICEF; 14 July 2024 https://www.unicef. org.uk/press-releases/global-childhood-immunization- levels-stalled-in-2023-leaving-many-without-life-saving- protection/#:~:text=%E2%80%8B15%20July%202024%20%7C%20 Geneva,Organization%20(WHO)%20and%20UNICEF.
5. Mikulic, M. Revenue of the worldwide pharmaceutical market from 2001 to 2023 [database]. Statistica; 2024 https://www.statista.com/ statistics/263102/pharmaceutical-market-worldwide-revenue- since-2001/.
6. Chadwick C, Friede M, Moen A, Nannei C, Sparrow E. Technology transfer programme for influenza vaccines – Lessons from the past to inform the future. Vaccine. 2022;40(33):4673-5. https://pubmed.ncbi.nlm.nih.gov/35810059/.
7. Increasing access to vaccines through technology transfer and local production [website]. World Health Organization; 2011. (https://www.who.int/publications/i/item/9789241502368).
8. African Vaccine Manufacturing Accelerator (AVMA): What is AVMA? [website]. Gavi; n.d. https://www.gavi.org/programmes-impact/ types-support/regional-manufacturing-strategy/avma.
9. Partnerships for African Vaccine Manufacturing (PAVM) Framework for Action [website]. AfricaCDC; 2022. https://africacdc.org/ download/partnerships-for-african-vaccine-manufacturing-pavm- framework-for-action/.
10. About us [website]. RVMC; n.d. https://rvmc.net/about-us.
11. Transforming global access to vaccines: Five reasons why UNICEF’s pooled procurement approach is crucial to deliver vaccines affordably and on time [website]. UNICEF; 2023. https://www.unicef.org/supply/stories/transforming- global-access-vaccines.
12. Vaccine Alliance reaches more than one billion children [website]. Gavi; 2023. https://www.gavi.org/news/media-room/vaccine- alliance-reaches-more-one-billion-children.
13. Manual for benchmarking and formulation of institutional development plans. Geneva: World Health Organization; 2023. Report No. https://iris.who.int/bitstream/hand le/10665/376137/9789240087637-eng.pdf?sequence=1.
14. GPW Impact Measurement Metadata [website]. World Health Organization; 2024. https://www.who.int/publications/m/item/ gpw-impact-measurement-metadata.
15. WHO/UNICEF Joint Reporting Process. WHO/UNICEF; 2024. https://www.who.int/teams/immunization-vaccines-and– biologicals/immunization-analysis-and-insights/global-monitoring/ who-unicef-joint-reporting-process#:~:text=The%20eJRF%20 collects%20countries%27%20annual,towards%20the%20 Immunization%20Agenda%202030.
16. Our Work [website]. Linksbridge; n.d. https://linksbridge.com/ our-work.
17. WHO/UNICEF Joint Reporting Process. WHO/UNICEF; 2024. https://www.who.int/teams/immunization-vaccines-and– biologicals/immunization-analysis-and-insights/global-monitoring/ who-unicef-joint-reporting-process#:~:text=The%20eJRF%20 collects%20countries%27%20annual,towards%20the%20 Immunization%20Agenda%202030.
18. Our Work [website]. Linksbridge; n.d. https://linksbridge.com/ our-work.
19. Resources: Database [online database]. National Medical Products Administration; 2024. https://english.nmpa.gov.cn/database.html.
20. Vaccines pricing data [online database]. UNICEF; 2024. https://www.unicef.org/supply/vaccines-pricing-data.
21. Gavi shipment reports [online database]. UNICEF; 2024. https://www.unicef.org/supply/documents/gavi-shipment-reports.
22. Gavi shipment reports [online database]. UNICEF; 2024. https://www.unicef.org/supply/documents/gavi-shipment-reports.
23. PAHO Revolving Fund Vaccine Prices for 2023 [website]. Pan American Health Organization (PAHO); 2023. https://www.paho.org/en/documents/paho-revolving-fund- vaccine-prices-2023.
24. International Coordinating Group (ICG) on Vaccine Provision [website]. WHO; n.d. https://www.who.int/groups/icg.
25. World Development Indicators database: Gross national income 2023,Atlas method [online database]. World Bank; 1 July 2024. https://datacatalogfiles.worldbank.org/ddh-published/0038127/ DR0046432/GNI.pdf?versionId=2024-07-01T12:42:55.5218615Z.
26. Programmes & Impact: Eligibility [website]. Gavi; n.d. https://www.gavi.org/types-support/sustainability/eligibility. 27. Our Alliance: Market Shaping roadmaps [website]. Gavi; 2024. https://www.gavi.org/our-alliance/market-shaping/market- shaping-roadmaps.
28. Archived CDC Vaccine Price List as of December 19, 2023 [database]. Centers for Disease Control and Prevention (CDC); 2023. https://archive.cdc.gov/#/details?q=https://www.cdc.gov/ vaccines/programs/vfc/awardees/vaccine-management/price- list/2023/2023-12-19.html&start=0&rows=10&url=https://www.cdc. gov/vaccines/programs/vfc/awardees/vaccine-management/price- list/2023/2023-12-19.html.
29. UN Operational Rates of Exchange [database]. United Nations; n.d. https://treasury.un.org/operationalrates/OperationalRates.php.
Hits: 1285
